- Ronan A. Cahill
- Donal F. O'Shea
- et al.
- 2020
- The British Journal of Surgery
Fluorescence-based Digital Surgery Decision Support
Analyzing and visualizing differences in blood flow patterns, made visible with fluorescent dyes and multispectral imaging.
Overview
Cancerous tissue differs from healthy tissue in many ways: in particular, it grows its own blood supply, which is typically chaotic and leaky. Our collaborative team, including quantitative scientists and colorectal surgeons, seeks to improve medical interventions by exploiting the resulting difference in blood flow patterns in order to detect and potentially delineate cancer. Specifically, a fluorescent dye called ICG and a Clinical Fluorescence Imaging System (CFIS) can be used to quantify the differences in blood perfusion, which is the passage of blood through the vascular system to tissues.
Current clinical usage of fluorescent dyes in colorectal surgery is limited to assessment of static fluorescent images — once a steady state has been reached — to guide intraoperative decisions. In this limited usage, important information encoded in the dynamic behavior, such as the rate of uptake and release of ICG fluorescence in tissues, is not utilized during surgery as it is challenging even for very experienced surgeons to visually estimate dynamic behaviors in real time. For example, when the ICG dye is washed out, it is difficult to tell which regions of tissue were perfused early and well, and which were not, and which retained the ICG dye longer. This information would be of key importance in colorectal surgery for tissue classification into healthy tissue/benign tumor/malignant tumor, and for tumor margin delineation in order to determine the position of transection. We designed novel biophysics-inspired AI tools for moving from a still image to flow of information encoded in dynamic behavior, such as uptake and release rates of ICG: this information is extracted, processed and the outcomes are made available through an Augmented Reality overlayed on the real-time feed from a CFIS (e.g. laparoscope or endoscope). The project can be grouped into three streams of data processing.
Considering isolated time series ("1D")
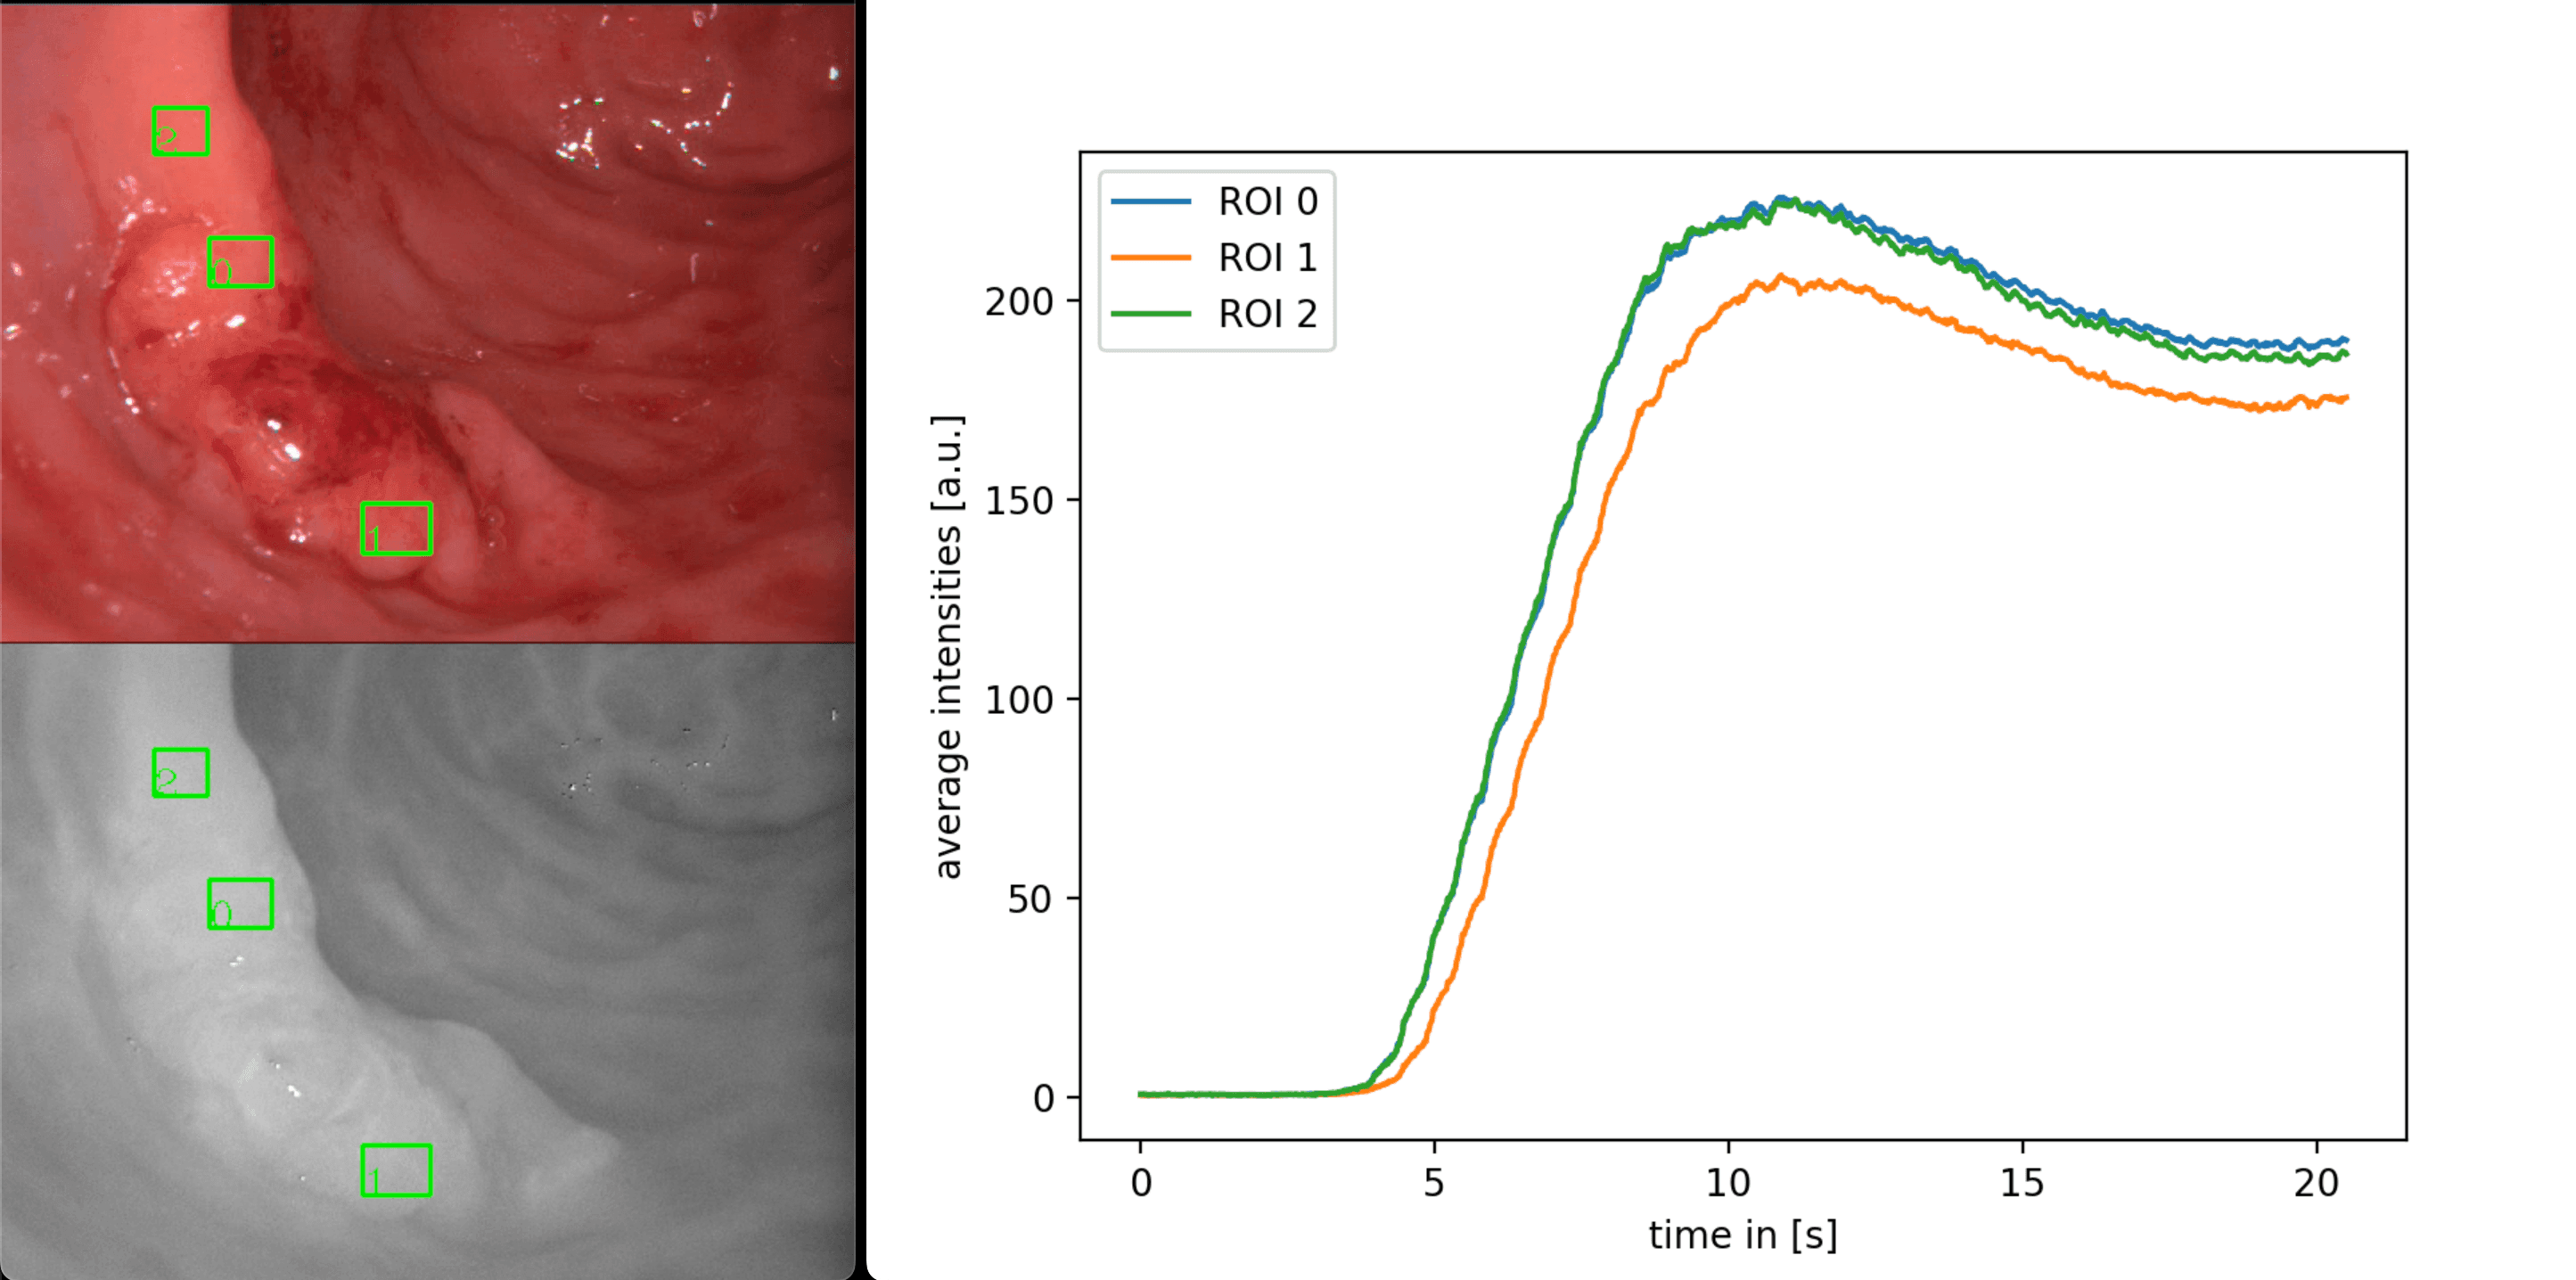
This approach is based on collecting the fluorescence over time for a few selected regions of interest (ROIs) and compressing those time series into a feature representation. The motion of the video has to be compensated, which superficially seems like a straightforward object-tracking problem, but turned out challenging. The feature representations of the collected time series can be based on parametric fits or simpler characteristic quantities, such as slopes and delays.
Data acquisition: The regions of interest (ROIs) are marked on the visible light image (left-top). A tracking algorithm keeps following the tissue within the ROIs throughout the procedure, and the brightness within the boxes in the near-infrared image (left-bottom) is collected as the measurement and plotted vs time (right).See also this video for the generation of such curves:
Tracking ICG fluorescence in cancerous/healthy tissue
Considering time evolution of a 2-dimensional intensity field ("2D")
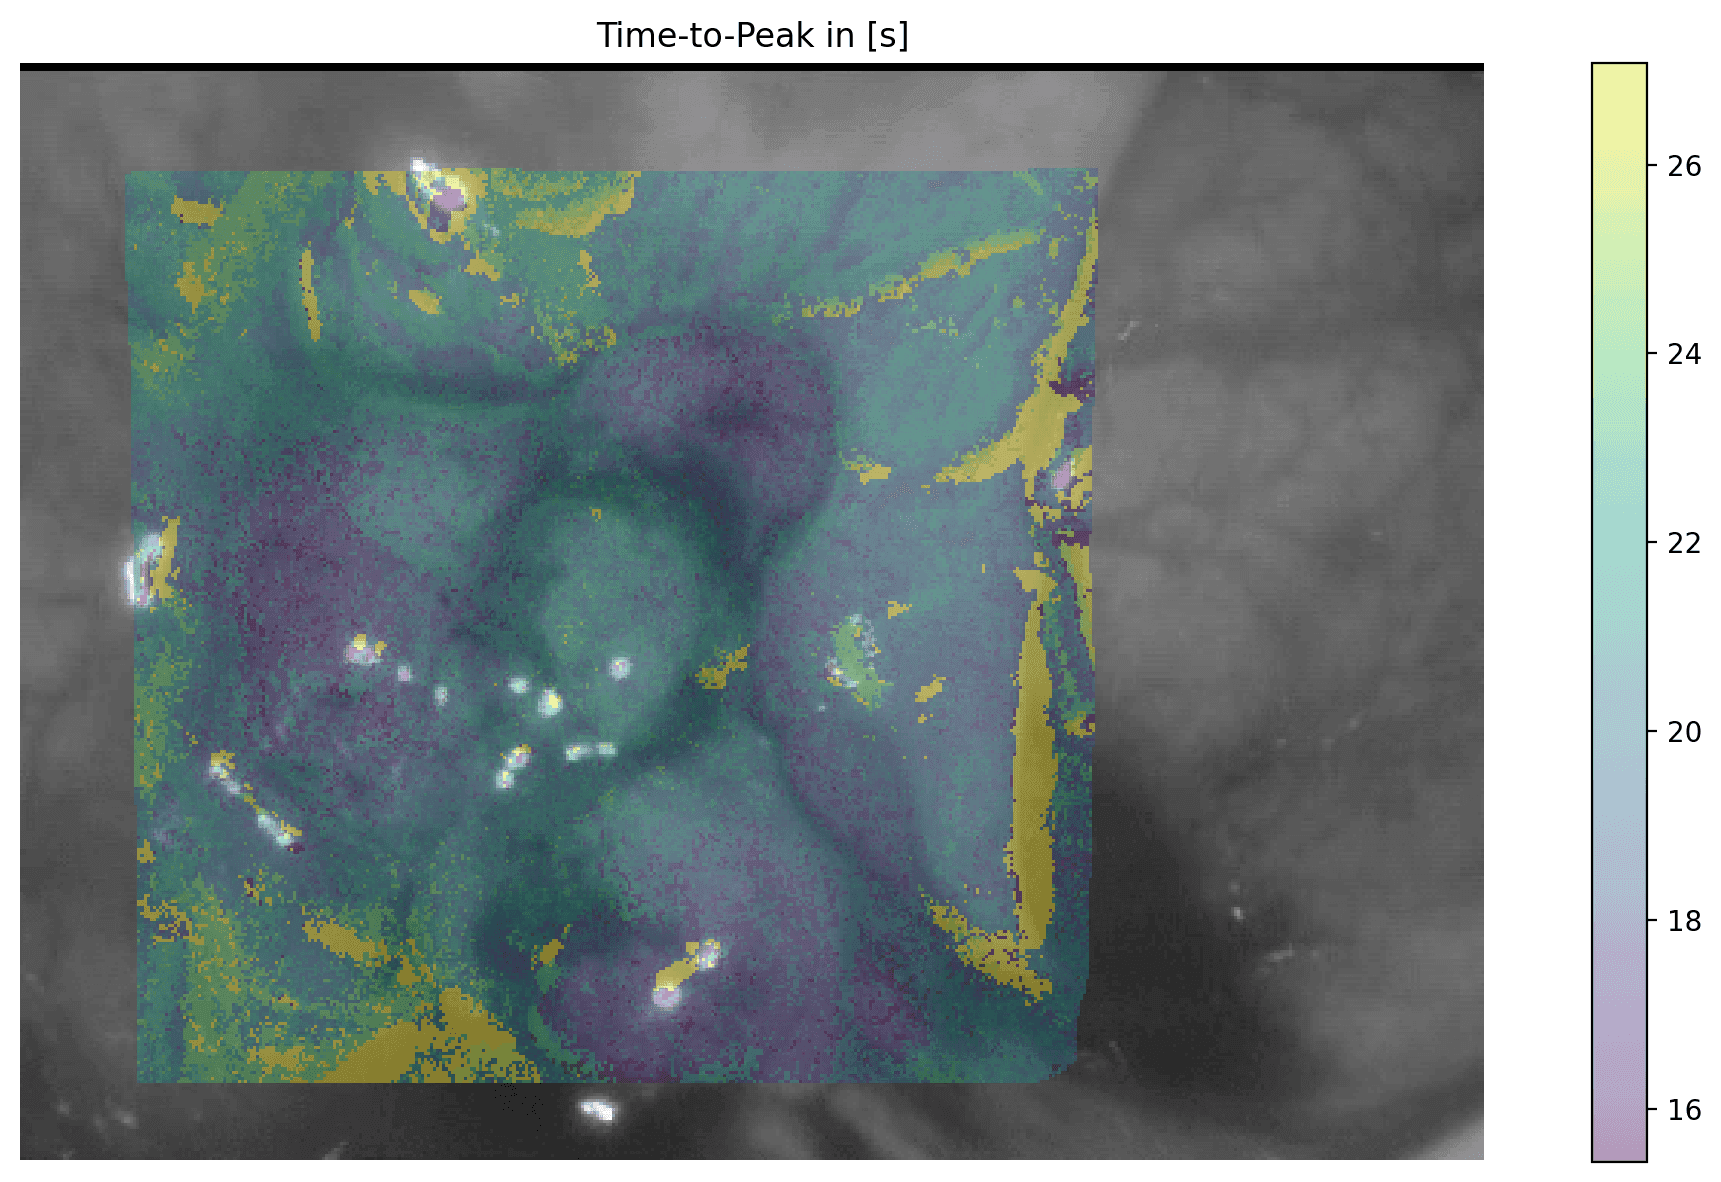
Instead of considering a few ROIs per video as data points in isolation, removing the motion from the entire video yields a spatially distributed measurement of the measured fluorescence intensity, I(y,x,t), where (y,x) ranges from (0,0) to (height, width), and _t_f denotes the frame number (or, if divided by the frame rate, time). As a first step, a single characteristic number can be computed, e.g. the time series' first moments, and presented to the surgeon as an additional source of information. The ultimate goal, however, is to learn pixel-level pathology and present it as a heat map colored, e.g., by confidence in malignancy predictions.
Stabilizing the entire video frame amounts to obtaining a brightness-vs-time curve for every pixel. Characteristic values of these curves can then be overlaid as a heatmap onto a still frame to provide information to the surgeon. E.g. here the time it takes to reach peak brightness is shown, and the surgeon sees that the blue lobes had slightly faster perfusion than the center of the growth.Inferring spatially distributed material properties ("3D")
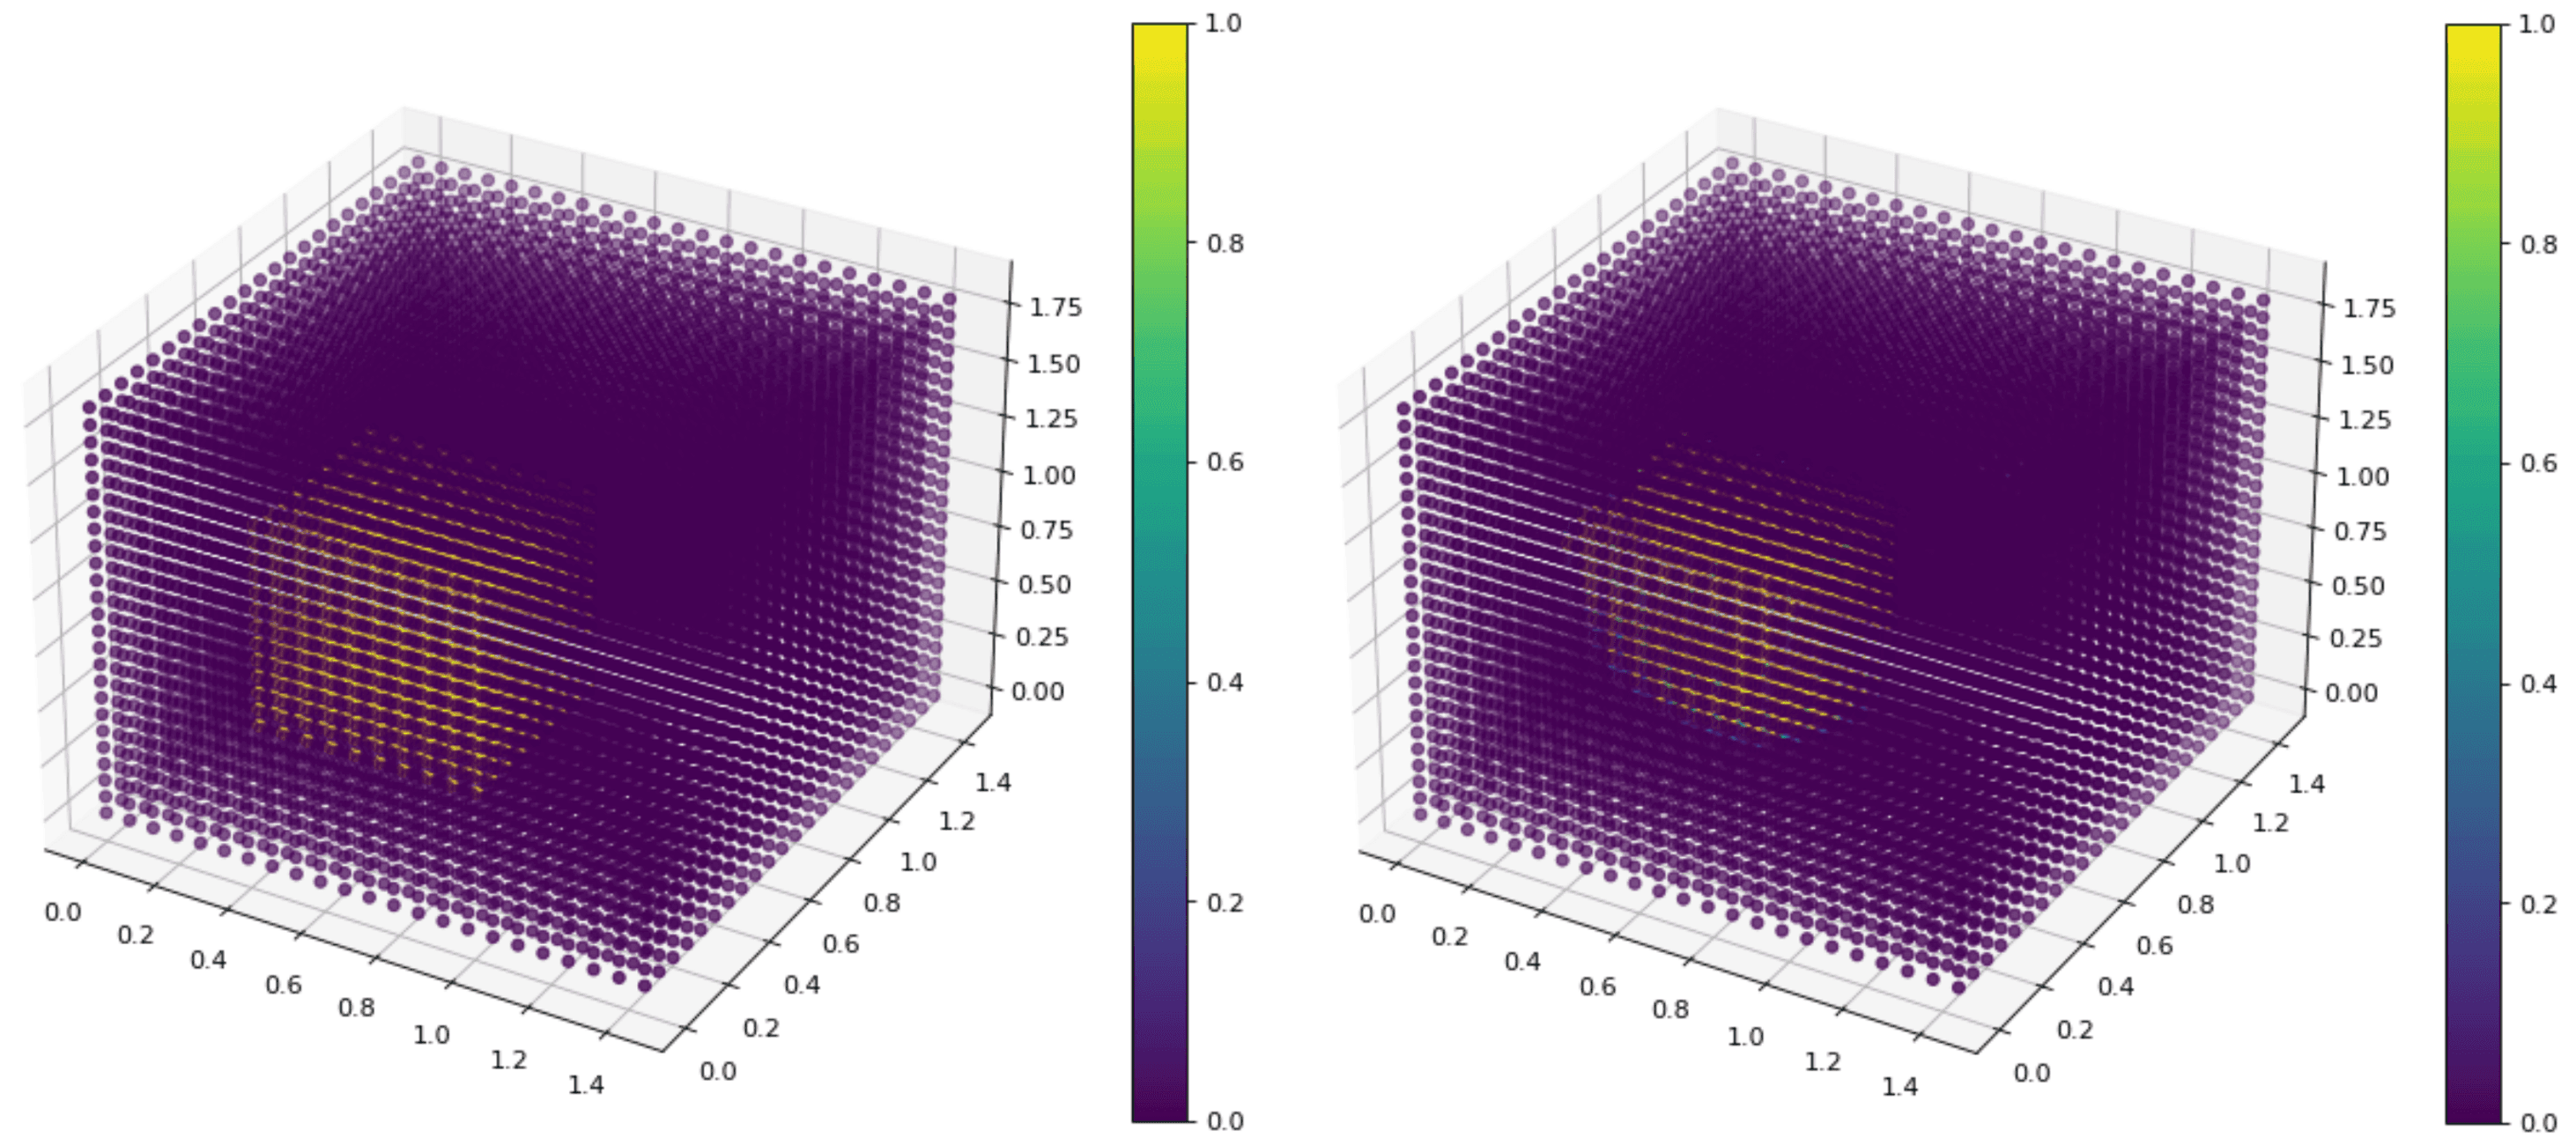
Structural and optical properties of the tissue can be inferred from the observed data by solving an inverse problem. In particular, spatially distributed absorption and scattering fields, which "explain" dynamic perfusion patterns of the molecular dye, are estimated from the observed data by means of Diffuse Optical Tomography (DOT), an emerging inverse modelling technique that estimates unknown parameters from observed data. It can be seen as a transformation from the "measured raw data" - spatio-temporal photon fluence rates I(y,x,t) or I(x,y,z,t) - into a "feature space" - comprising absorption and scattering fields A(y,x) or A(x,y,z). For future work, machine learning techniques can make use of this feature space. To the best of our knowledge such a feature space has not yet been discussed in the scientific literature on medical biophysics, optics and AI in surgery.
Reconstruction of a block of ICG embedded in a block of tissue-like material based solely on brightness measurements on 5 surfaces of the larger block. Left: ground truth, right: reconstruction.Open-Source Tools
Publications
- Jeffrey Dalli
- Niall Hardy
- et al.
- 2021
- Colorectal Disease
- Niall Hardy
- Pól Mac Aonghusa
- et al.
- 2021
- Surgical Innovation
- Sergiy Zhuk
- Jonathan Epperlein
- et al.
- 2020
- MICCAI 2020
- Jonathan P. Epperlein
- Niall P. Hardy
- et al.
- 2022
- ICDH 2022
- Jonathan Epperlein
- Mykhaylo Zayats
- et al.
- 2021
- AMIA Annual Symposium 2021